A monitor for private funds and companies
This is the application I built and run over a family office's private-markets book: the funds and the direct companies, what they report and when, what the reports say, and which of them need a look this week. It is captured here page by page as a static site over an invented book, so you can click through exactly what the desk uses, with every fund, company, figure, document and headline in it made up.
What it is, and who uses it
The private book is the hardest part of a family office's portfolio to see clearly. Funds report quarterly and late, in capital-account statements that each administrator formats differently. Direct companies send investor letters, board decks and management accounts in their own shapes and on their own cadence, or stop sending them when things get hard. Marks move rarely and are stale most of the time. The question the office actually needs answered — which of these positions needs attention now, and why — was being answered by reading PDFs.
The PE / VC Monitor is a reading layer over the office's own record of its private positions. It takes the positions the Family Office platform already holds (cost, mark, distributions, performance) and adds everything the office learns about them from what they send: every document classified and dated, every investor letter read into dated headlines and proposed figures, every company's own accounts kept period by period with a tie-out, and every fund's schedule of investments read into a holdings grid. A review queue sits between the reading and the record, so a figure a model proposed never counts until a person approves it.
On top of that record it keeps a small universal spine of operating metrics for every company — revenue, EBITDA, cash, burn, runway, headcount — scored against the plan the company itself sent, within one reporting cadence, so a miss is visible the month it happens. Coverage says who is actually reporting against the cadence the office expects. Attention rules flag a stale mark, a stalled income stream, an underwater position, a high risk score or a data gap. The overview page is the answer to the office's question, with the evidence one click below it.
The capabilities
Positions
Every fund and direct position with cost, mark, realised proceeds, unfunded commitment, multiples and IRR, drawn from the family-office platform's record so the two can never disagree, with the office's allocations and the share of each vehicle the family actually owns.
Attention rules
Positions flagged by rule rather than by memory: a mark that has not moved in too long, an income stream that has stalled, a position marked below cost, a high risk score, a gap in the data the office expects. Each flag names the rule and the figure that tripped it.
The operating scorecard
A universal spine of metrics for every direct company (revenue, EBITDA, cash, burn, runway, headcount) scored against the plan the company sent, within one reporting cadence, with red and amber exceptions on one board.
Coverage
Who is actually reporting: the newest document on file for each position against the cadence the office expects, split into current, overdue and dark, with the dark companies and the fund holdings queued first for extraction.
Documents become data
Every file a company or fund sends is classified and dated from its name, the investor letters are read by a model that proposes figures and a headline, and the company's own accounts are kept period by period as they wrote them, with a tie-out that says whether the figures add up.
The review queue
Figures and headlines the reader proposed from a document wait here for a person to approve or reject them; nothing proposed counts in a position, a scorecard or a feed until it has been approved, and a rejection is kept as a decision.
Updates and the story of a deal
The book's news feed: every headline read out of an investor letter, dated and ranked by significance; and for any one company, its whole history in order — the cheque, every report and letter since, and every dollar back.
Funds get their own lens
A blind pool has no P&L but it has a portfolio: the schedule of investments is read into a holdings grid, companies down and report dates across, with the fund's own printed totals kept beside the parsed figures so a parsing error can never pass as a fact.
Capital is attributed
A commitment or a balance read off a statement is tagged with whose position it describes, so a pooled vehicle's figure can never be shown as the office's own and a co-investment is never double counted.
Nine screens, one book
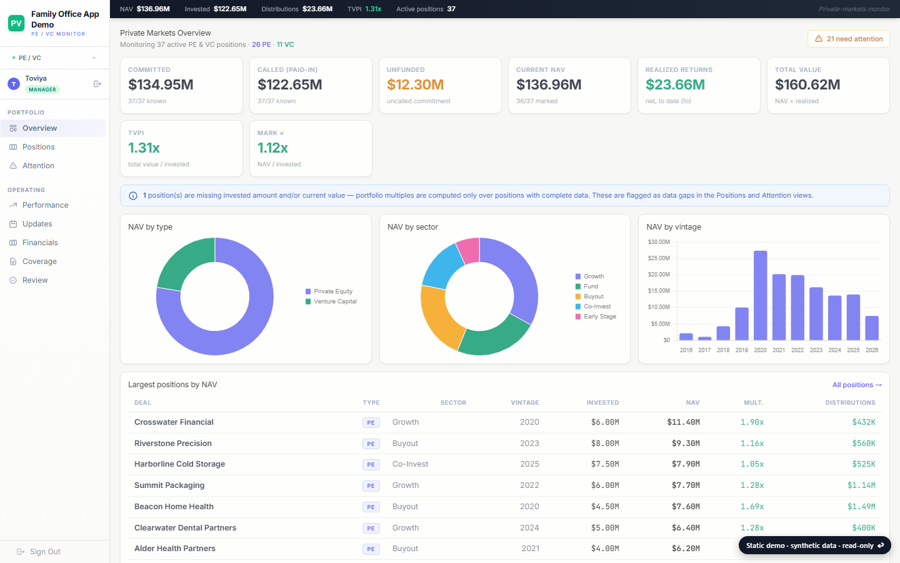
Overview
The private book at a glance: invested, marked, realised and unfunded, the allocations, and the positions that need a look this week with the rule that flagged each.
Open →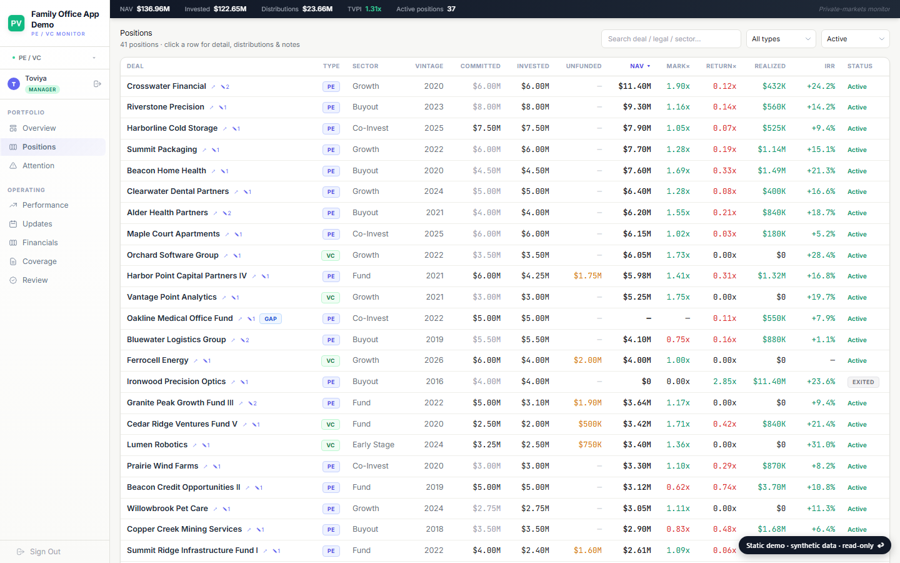
Positions
Every fund and direct position with cost, mark, realised, multiples, IRR and unfunded commitment, drawn from the family-office platform's own record.
Open →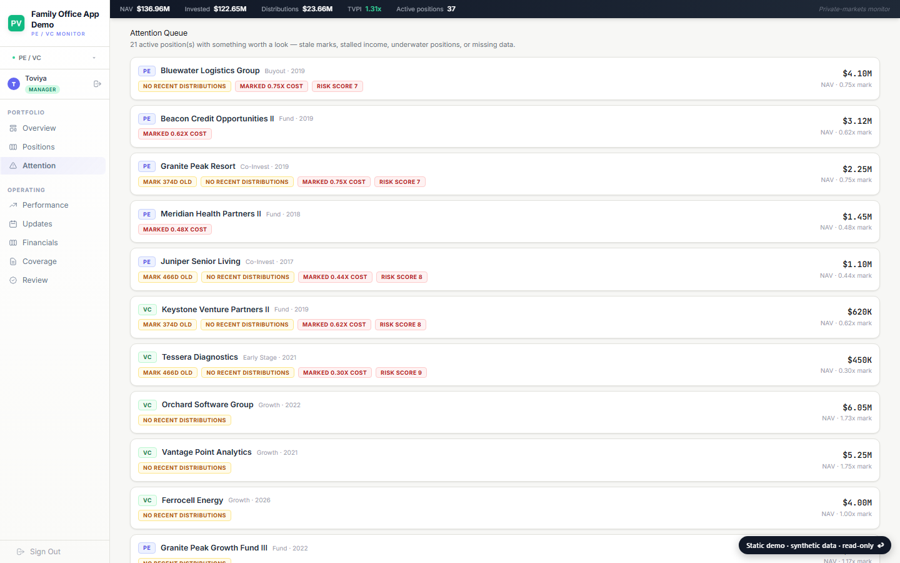
Attention
Positions flagged by rule: a stale mark, a stalled income stream, an underwater mark, a high risk score, a data gap, each with the figure that tripped it.
Open →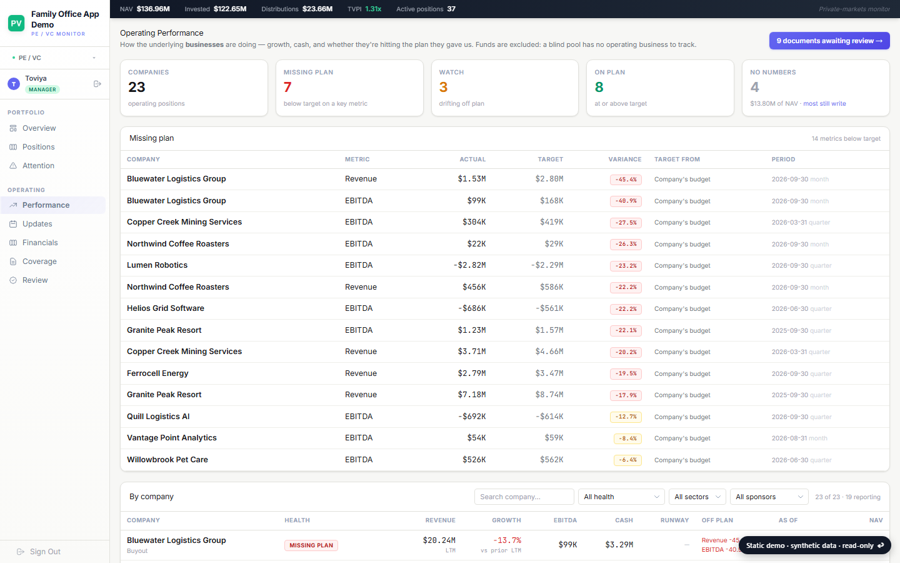
Operating
The direct companies on one board: revenue, EBITDA, cash and runway against plan, with red and amber exceptions and the report each figure came from.
Open →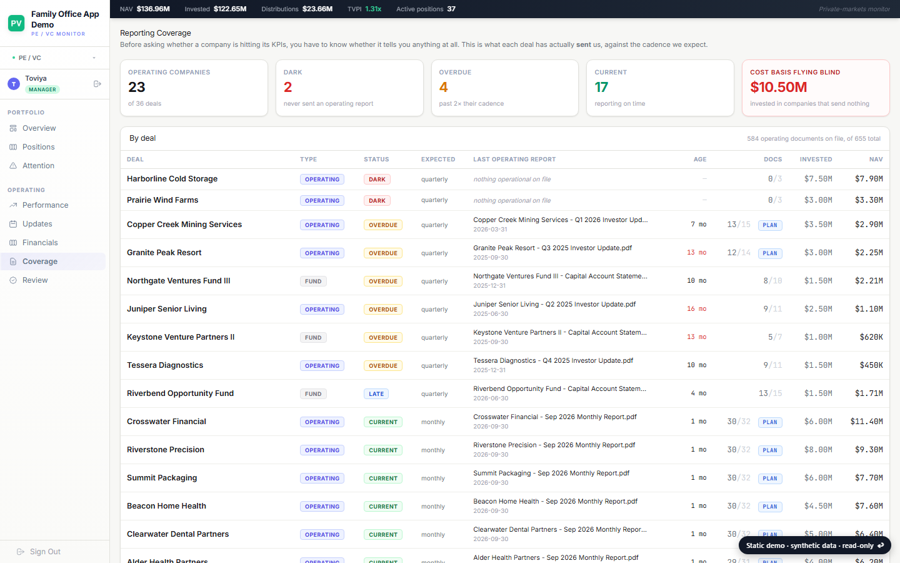
Coverage
Who is actually reporting to us: the newest document on file for each position against the cadence we expect, split into current, overdue and dark.
Open →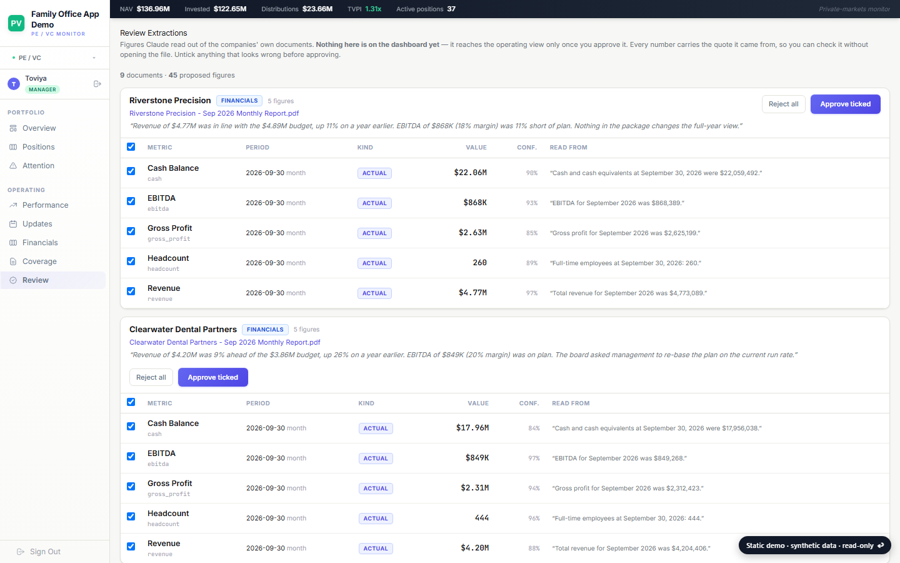
Review queue
Figures and headlines the reader proposed from a document, waiting for a person to approve or reject them before they count anywhere.
Open →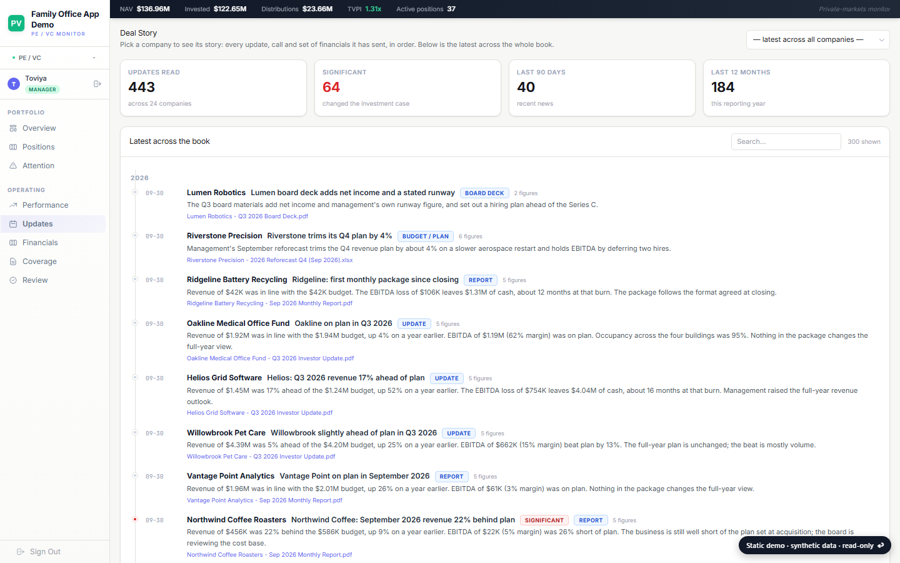
Updates
The book's news feed: every headline read out of an investor letter, dated and ranked by significance, with the document behind it.
Open →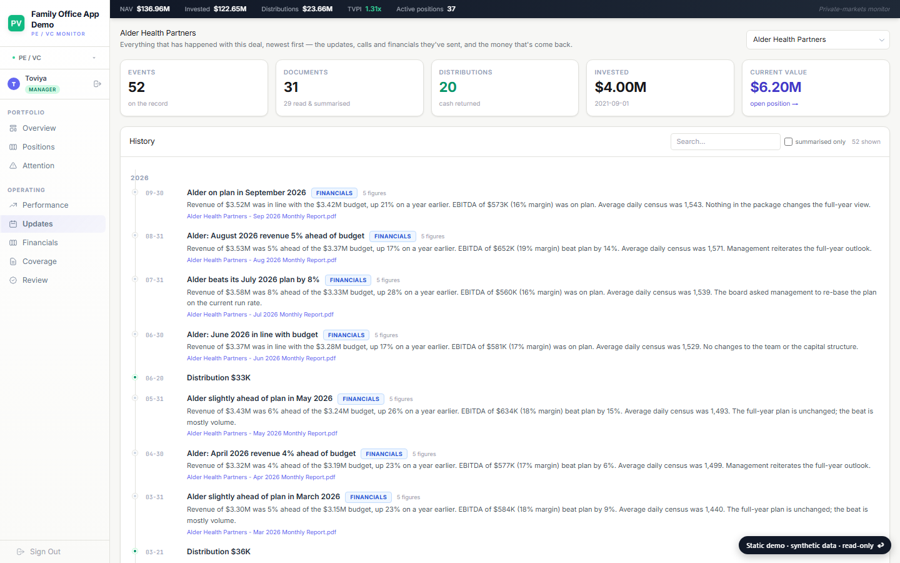
A deal's story
One company's history in order: the cheque, every report and letter since, every figure proposed and approved, and every dollar back.
Open →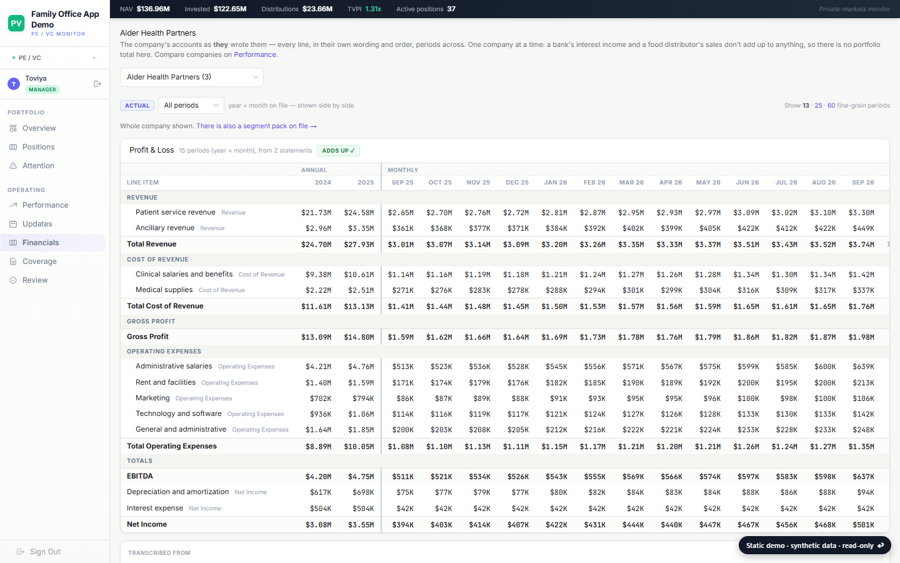
Financials
A company's own accounts as they wrote them, periods across, with a tie-out that says whether the figures add up and the growth read against the prior period.
Open →What you are looking at
The PE / VC Monitor is a read-only reporting layer over the family office's own record of its private investments. It takes the positions the Family Office platform already holds (cost, mark, distributions, performance) and adds the part that record never had: how each operating company is actually doing, who is reporting and who has gone dark, and a running story of what has happened to every deal.
Some of the parts worth a look:
- The operating layer keeps a small universal spine of metrics for every company (revenue, EBITDA, cash, burn, runway, headcount) and scores each against the plan the company sent, within one reporting cadence, so a monthly figure is never judged against an annual one.
- Documents become data. Every file a company sends is classified and dated from its name; the investor letters are read by a model, which proposes figures and a headline that a person then approves or rejects. Nothing it proposes reaches the book without that click.
- Funds get their own lens. A blind pool has no P&L, but it does have a portfolio: the schedule of investments is read into a holdings grid, companies down and report dates across, with the fund's own printed totals kept beside the sum of the rows.
- Capital is attributed. A commitment read off a statement is tagged with whose position it describes, so a pooled vehicle's figure can never be shown as the office's own.
How it is built
Python and Flask on PostgreSQL, server-rendered pages with Alpine.js. The monitor is deliberately read-only over the positions themselves: it reads them from the Family Office platform through an internal API and adds its own tables for documents, extracted figures, operating metrics, reviews and headlines, so the office's record of what it owns has exactly one writer.
- Extraction has priorities. Dark companies and fund holdings are read first, because they are where the office knows least; a company that reports well is read for its figures, a fund for its portfolio.
- Statements are stored as tables, not as text, period by period as the company wrote them, so a tie-out can check that revenue less costs equals the profit they printed, and a figure can be compared across reports.
- The operating spine is universal. Six metrics every company can report, scored against the company's own plan within one cadence, so companies in different industries can share one exceptions board without pretending their businesses are alike.
- Shared platform. Single sign-on with the other applications, the same database cluster, nightly backups to two object stores and a deploy on every push.
- Several hundred tests, checked by mutation, including the readers driven over statement shapes the office has actually received.
The code itself is private. If you would like to walk through it, get in touch.